• HSLogo_color

An Introduction to Data Visualization

Free Download

data-visualization

How to design compelling charts & graphs that are easy to understand

Ready to make a big impact with your data?

Your data is only as good as your ability to understand and communicate it. You need to be able to understand and effectively communicate the story behind those numbers. The best way to tell a story with your data is by visualizing it using a graph or chart.

When you can visualize your data in one of these formats, you'll be able to more easily uncover patterns, correlations, and outliers, communicate insights to your boss, your team, or your company, and make data-backed decisions.

The good news is that you don’t need a PhD in statistics to crack the data visualization code. If your technical skills don’t extend much beyond Microsoft Excel (you’re not alone!), then check out the list of the best data visualization tools we've included as well.

Frequently Asked Questions (FAQs)

  • Data visualization is the process of representing information in a graphical form, with the goal of aiding human decision-making. Visualizations can help you find insights in your data that are difficult to uncover using raw numbers. These insights can help tell a story to influence important decisions.

  • Data visualization is the process of making data easy to understand by translating it into a visual format. It allows for better understanding and quicker processing than when dealing with raw numbers alone. Data visualization is an important part of today's world because it simplifies complex information, allowing us to make sense of what would otherwise be impossible.

  • We will always keep your personal information safe.

    We ask for your information in exchange for a valuable resource in order to (a) improve your browsing experience by personalizing the HubSpot site to your needs; (b) send information to you that we think may be of interest to you by email or other means; (c) send you marketing communications that we think may be of value to you. You can read more about our privacy policy here.

  • The scope of data visualization is not just limited to pie charts and graphs. The story-telling aspect of a data visualization helps teams stay informed about any new promotion or product launch in real-time.

  • Absolutely!

    Just sharing some free knowledge that we hope you’ll find useful. Keep us in mind next time you have marketing questions!

  • Data visualization is the practice of turning raw data into a graphic or interactive representation that can be easily consumed by anyone. When you're able to visualize your data in one of these formats, you'll be able to more easily uncover patterns, correlations, and outliers, communicate insights to your boss, your team, or your company, and make data-backed decisions. Download our free data visualization guide pdf.
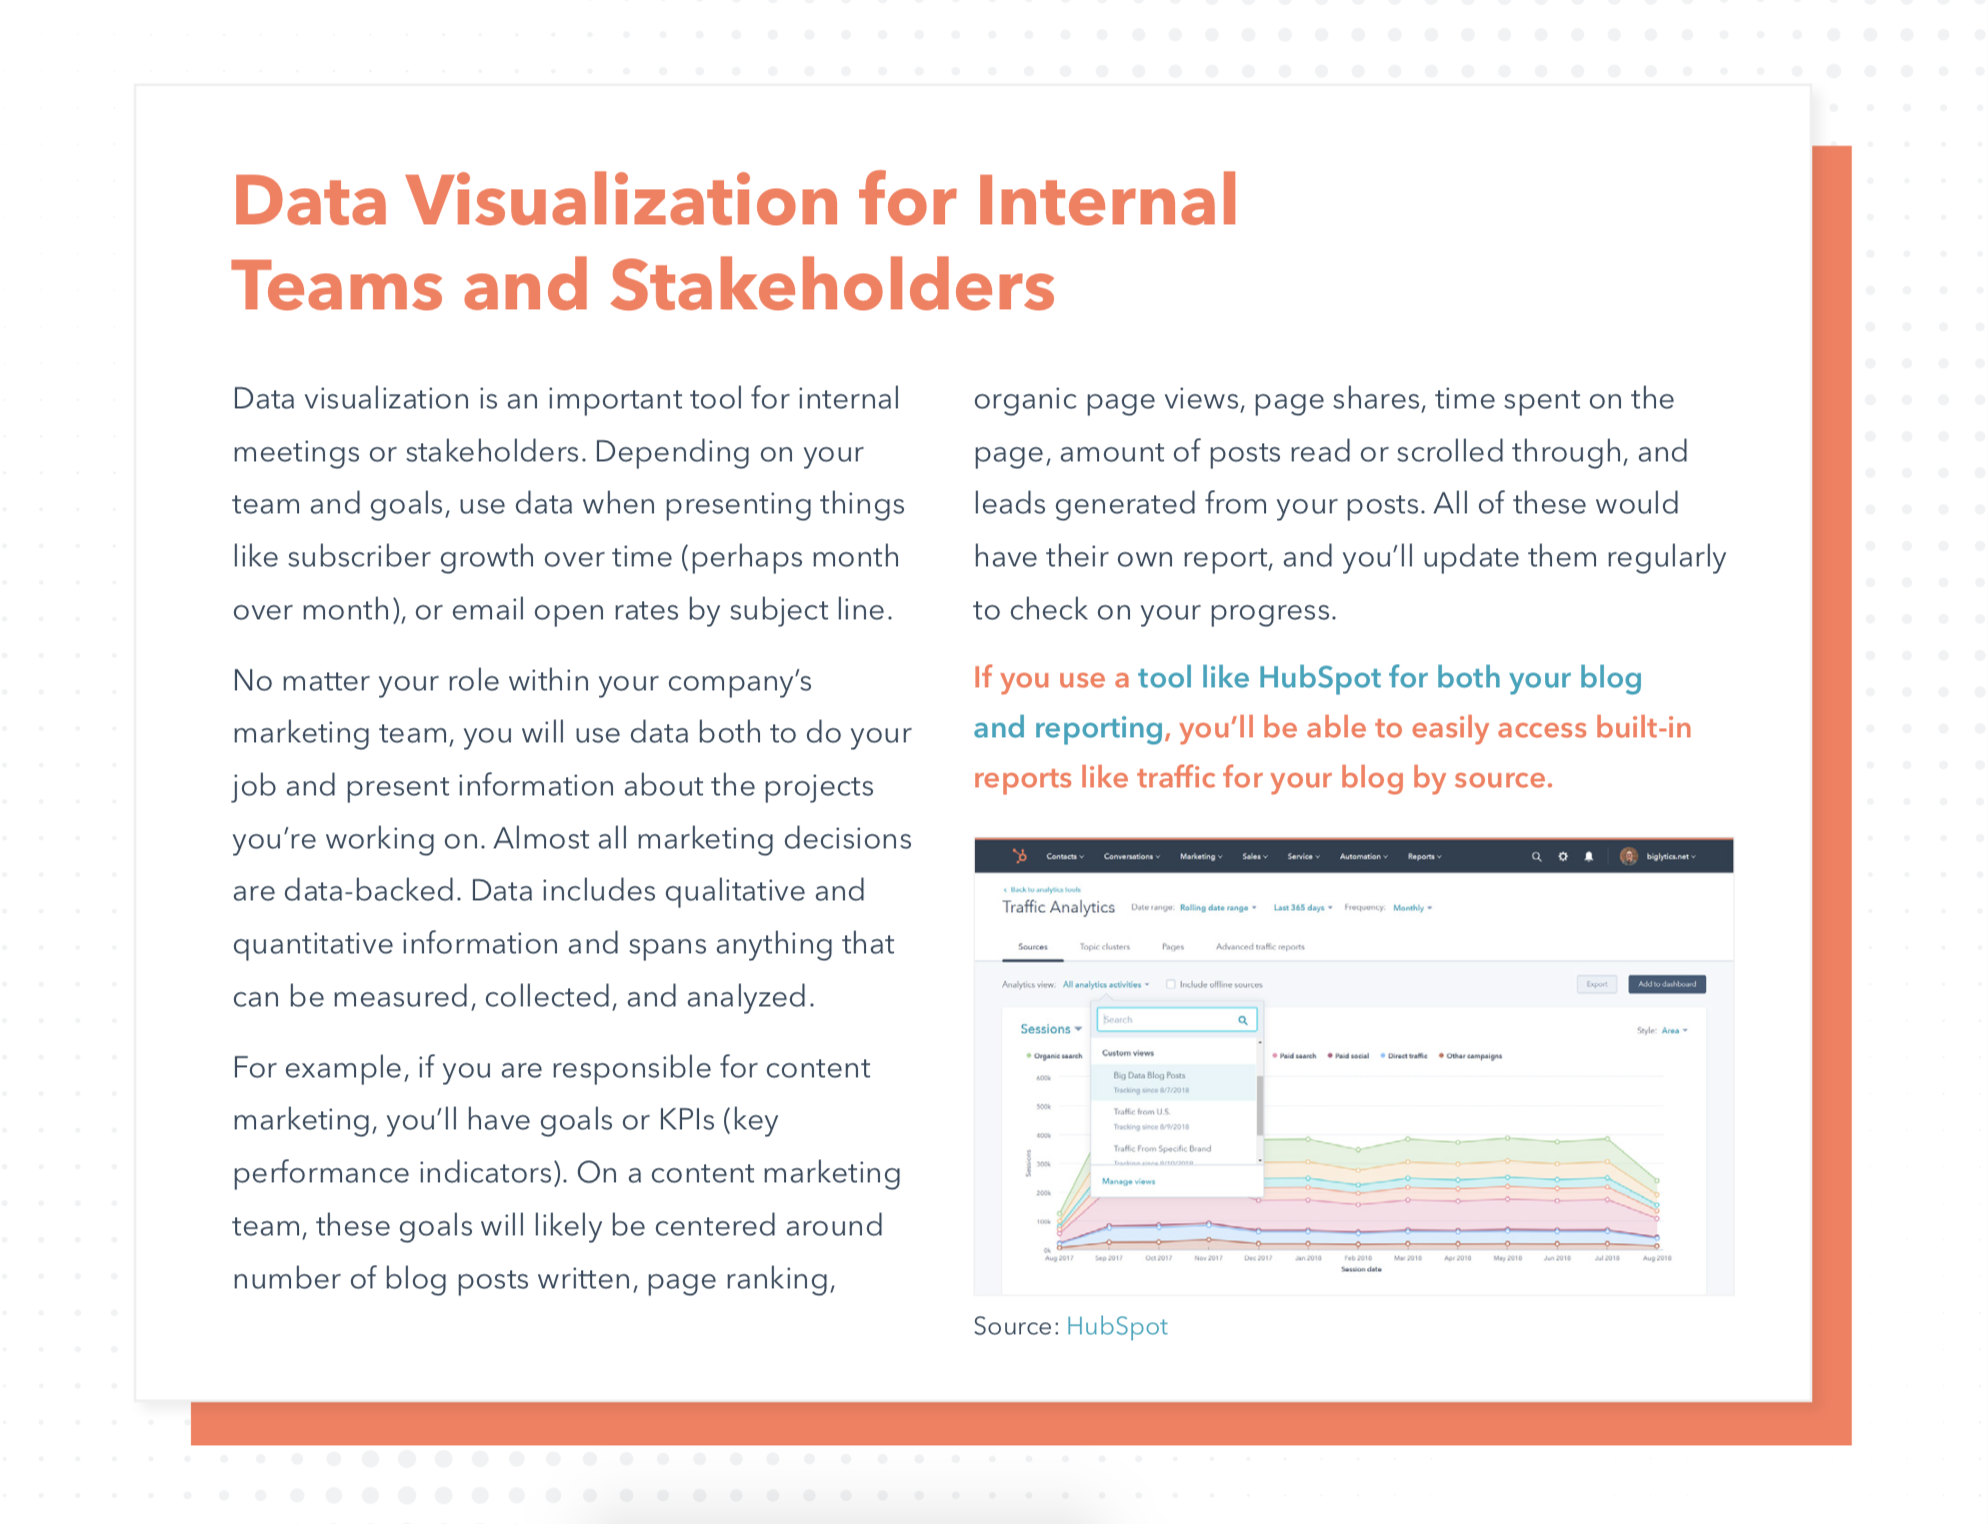
  • Data visualization is the practice of translating information into a visual context, such as a map or graph, to make data easier for the human brain to understand and pull insights from. Data visualization can be used in many ways: it can help tell stories about our world, provide feedback on design decisions, and explore large data sets that are too complex for humans to comprehend otherwise.

Design compelling charts & graphs that are easy to understand